Pakistan Institute of Development Economics
- Home
Our Portals
MenuMenuMenuMenuMenuMenuMenu - ResearchMenuMenuMenuMenuMenuMenuMenu
- Discourse
- The PDR
- Our Researchers
- Academics
- Degree Verification
- Thesis Portal
- Our Portals
Analysis Of Trade In Goods Agreement Between Pakistan And Turkey
INTRODUCTION
A Framework Agreement Establishing a Free Trade Area between Pakistan and Turkiye was signed on March 22, 2016, in Islamabad, and it included a trading in goods agreement, or preferential trade arrangement, that Pakistan and Turkiye would sign on August 12, 2022. Accordingly, Turkiye grants Pakistan privileged access to 261 tariff lines that are of interest to its market, and she has received the same treatment for 130 tariff lines that are of interest to her.
For the past few years, Turkiye has benefited from a positive trade balance with Pakistan. Textiles have historically been the most frequently exchanged commodity between the two nations. It accounts for 30.28% of Turkish exports to Pakistan and 73.83%1 of Pakistani exports to Turkiye. It is noteworthy that Turkiye was able to include four tariff lines from the textiles group in the list of commodities eligible for preferential treatment, whereas Pakistan could not manage to include a single tariff line. The exporting country needs to understand the priority products for which preferential or duty-free treatment should be requested from the importing countries during preferential trade discussions. This study’s goal is to create a list of potential export goods for which Pakistan should be given preferential status. The research is based on trade and tariff data from Comtrade and Trains (Trade Analysis Information System), both developed by UNCTAD (United Nations Conference on Trade and Development). More specifically, it will calculate bilateral trade complementarities, revealed comparative advantage indices, and run tariff simulations to know how much trade creation would occur if Turkiye offered duty-free treatment to its imports sourced from Pakistan using SMART partial equilibrium tool.2
BILATERAL TRADE BETWEEN PAKISTAN AND TURKIYE
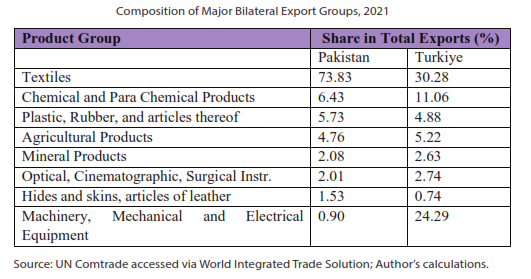
Total exports from Pakistan to Turkiye were 293.58 million dollars, while imports from Turkiye were 773 million dollars, resulting in a 479 million-dollar trade deficit for Pakistan in 2021. Table 1 shows the shares of major bilateral export product groups between Pakistan and Turkiye. It is evident from the table that Pakistan’s exports consist of low value-added products as compared with those of Turkiye. The textiles group dominates the export basket of Pakistan with
73.83 percent, followed by chemical products (6.43 percent), products of plastic and rubber (5.73 percent), and agricultural products (4.76 percent). Agricultural products include products of dairy, fish, meat, rice, and other food items.
___________
[1] Author’s calculations based on Comtrade data.
[2] Developed by ESCAP’ Trade Intelligence and Negotiation Advisor.
___________
The largest export group consists of raw materials (88.52 percent) and knitted or crocheted articles of apparel, clothing accessories, and other made-up textile articles, together with certain sets of worn textile articles and rags (10.75 percent). In the Turkish market, the average duty rate for high-value textile products is 12 percent, while the average duty rate for raw material products is 8 percent. Surprisingly, the textile sector, which accounts for 73.83 percent of total Pakistan’s
exports to Turkey, lacks a single tariff line in the trade-in goods agreement. The chemical group’s product lines that are granted preferential treatment under the agreement were already exempt from customs duties before the arrangement. However, as agricultural products and the plastic and rubber industries are the main recipients of the deal’s benefits, it is anticipated that these industries’ exports will increase greatly as a result of the agreement. Turkiye’s major export products to Pakistan, on the other hand, include textiles (30.28 percent), machinery, mechanical and electrical equipment (24.29 percent), chemical and para-chemical products (11.06 percent), and agricultural products (5.22 percent of total exports to Pakistan).
It is crucial to note that Pakistan excels in a variety of low-quality, low-value-added product categories. These goods are vulnerable to price fluctuations on the global market and do not generate significant amounts of the country’s desperately needed foreign exchange.
TRADE COMPLEMENTARITY INDEX
The trade complementarity index (TCI), introduced by Michaely (1996) is a type of overlap index which measures the degree to which the export pattern (it can also be calculated on the import side) of the reporter country matches or complements the import pattern of the partner country. A high value of the TCI may imply that trading partners would gain from increased trade. Changes in the TCI over time may tell us whether the trade profiles are becoming more or less compatible. TCI is defined as the sum of the absolute value of the difference between the import category shares and the export shares of the countries under study, divided by two. The following formula is used to compute the index:
Where d is the importing country of interest, s is the exporting country of interest, w is the set of all countries in the world, i is the set of industries, x is the commodity export flow, X is the total export flow, m the commodity import flow, and M the total import flow. Division by two yields a value between 0 and 1. The two extreme values respectively reflect no complementarity at all and perfect complementarity. The value thus obtained is subtracted from 1 to reverse the sign and is multiplied by a hundred to obtain the TCI in percentage form.
Table 2 displays that Pakistan’s import pattern complements Turkiye’s export pattern more so, over time, than Pakistan’s import pattern complements Turkiye’s export pattern. In other words, Turkiye will benefit more than Pakistan from preferential treatment of both trading nations’ exports.
REVEALED COMPARATIVE ADVANTAGE RCA
Comparative advantage underlies economist’s explanations of the observed pattern of inter-industry trade. In theoretical models, comparative advantage is expressed in terms of relative prices evaluated in the absence of trade. Since these prices are not observed, in practice, we measure comparative advantage indirectly. Revealed comparative advantage indices use the trade pattern (Balasa, 1965; and Laursen, 2000; CEPII, 2019) to identify the commodities/sectors in which an economy has a comparative advantage, by comparing the trade profile of a country with the world average. Analysis of comparative advantage is very useful in a wide range of contexts. For example, while doing trade tracker analysis, RCA proves very useful in identifying industries/sectors in which a country appears to enjoy a comparative advantage and the industries/sectors where the comparative advantage is changing for the better or worse. The RCA also proves useful in the formulation and evaluation of trade policies and potential FTAs and indicates the extent to which a given agreement is likely to be welfare-enhancing or otherwise. Finally, RCAs help identify potential export opportunities. It is calculated by the following formula:
Where, s is the exporting country, d is the importing country and w is the set of all countries in the world, i is the commodity/sector of interest, x is the commodity export flow and X is the total export flow. It is a ratio of two shares. The numerator is the share of good i in the exports of country s, while the denominator is the share of good i in the exports of world. In other words, it is the ratio of the exports of the commodity from the source to total exports from the source, over the same ratio for the world. Comparative advantage can be calculated in general as standard revealed comparative advantage (SRCA) or for a bilateral relationship as bilateral comparative advantage (BRCA).
To calculate RCA, this study considers all the products valued at at least 1000 USD imported by Turkiye, whether from Pakistan or the rest of the world. There are examples where Pakistan exports some products to the world and Turkiye imports those same products from the rest of the world but not from Pakistan. In cases when BRCA cannot be identified, tables indicate NA (not available) (Turkiye is not sourcing imports of that particular product from Pakistan). Since Turkiye trades these goods with the rest of the world, their inclusion is justified by the possibility of expanding bilateral trade in these areas.
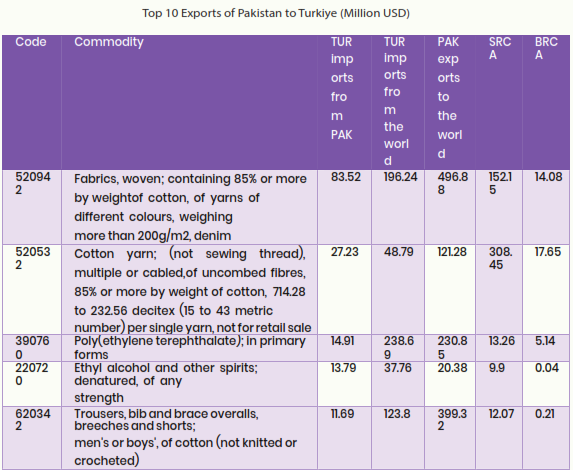
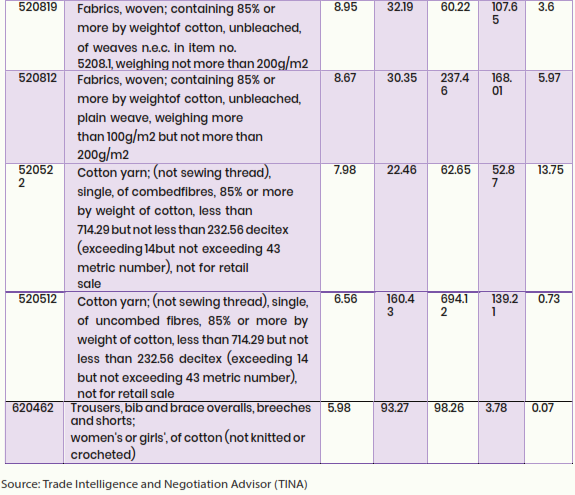
The top ten products that Pakistan exports to the rest of the world, to Turkiye, and that Turkiye imports from the rest of the world are listed in Table 3, along with Pakistan’s standard revealed comparative advantage (SRCA) and bilateral revealed comparative advantage (BRCA) in relation to those products. The areas where Pakistan has a comparative advantage are textiles, agriculture, live animals, and animal products (meat, fish, dairy products, eggs, honey, other edible products, and inedible products), all of which have low levels of added value.
SIMULATION RESULTS
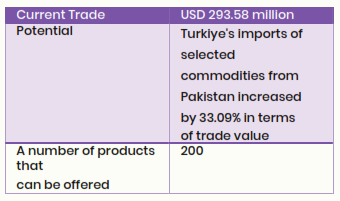
Table 4 reports the simulation results. It takes into account (i) all products worth at least USD 1,000 imported by Turkiye, whether from Pakistan or the rest of the world; (ii) Pakistan’s ability to expand exports; (iii) Pakistan’s comparative advantage in that product; and (iv) Turkiye’s tariff on that product. Table 4 says that Pakistan can increase its exports to Turkiye by 33.09 percent, by trade value, if duty-free access is granted to the identified potential 200 products. Pakistan should pursue preferential treatment in the Turkish market on the products of jackets and blazers; men’s or boys’; of cotton (not knitted or crocheted); knitted or crocheted articles of apparel and clothing accessories; and other articles of apparel and clothing accessories; staple fibers; woven; containing 85% or more by weight of cotton; of yarns of different colors; 3-thread or 4-thread twill, including cross twill, weighing not more than 200g/m2, Carpets and other textile floor coverings; knotted; of wool or fine animal hair, whether or not made up to. A complete list of the simulated products is attached as an excel sheet.
CONCLUSION
It is unlikely that the trade in goods agreement will considerably improve Pakistan’s exports. Since none of the tariff lines that make up a significant portion of Pakistan’s exports are given preferential status. However, based on the aforementioned criteria, this analysis provides a list of 200 potential products that, if granted duty-free status in the Turkish market, could increase Pakistani exports to Turkey by 33% in the short term. Additionally, with a deeper integration agreement (taking care of non-tariff measures), bilateral trade could increase to a magnitude greater than it is at the moment. The textile industry is important to both nations as it accounts for 30% of Turkiye’s bilateral exports to Pakistan and 74% of Pakistan’s bilateral exports to Turkiye. To significantly increase its exports, Pakistan should strive to negotiate an intra-industry trading agreement with Turkiye. Exports from Pakistan are not anticipated to increase much without requesting preferential status for the textile industry.
REFERENCES
Annual Analytical Report On External Trade Statistics of Pakistan FY 2020-21, External Trade Section, Pakistan Bureau of Statistics, Ministry of Planning, Development & Special Initiatives, Government of Pakistan.
Balassa, B. (1965). Trade liberalization and ‘revealed’ comparative advantage. The Manchester School, 33, 99–123.
COMTRADE, United Nations Conference on Trade and Development, http://unctadstat.unctad.org.
Laursen, K. (2000). Trade specialization, technology and economic growth: Theory and evidence from advanced countries. Cheltenham: Edward Elgar
Michaely, M. (1996). Trade preferential agreements in Latin America: An ex ante assessment. Washington D.C: The World Bank. (Policy Research Working Paper 1583).
Trade Intelligence and Negotiation Advisor, United Nations Education and Scientific Commission on Asia and Pacific (UNESCAP), https://tina.trade/.
Trade Analysis Information System (TRAINS), United Nations Conference on Trade and Development, http://unctadstat.unctad.org.
World Integrated Trade Solution (WITS), World Bank, https://wits.worldbank.org/.

